Real estate in Paris has proven an excellent investment over the past four years, and we are proud to have predicted it. For 2019, we believe it will continue its upward path. In terms of leading indicators, both prices, as well as the volume of sales in Paris, continue to show healthy increases. For 2019, we believe the rise will continue, but at a slower pace. Read on to learn more from our Paris real estate report.
2019 Paris Real Estate Report
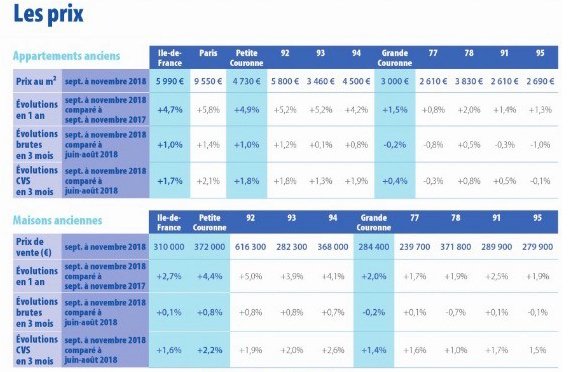
2018 Prices for Apartments in Paris: Hitting New Highs
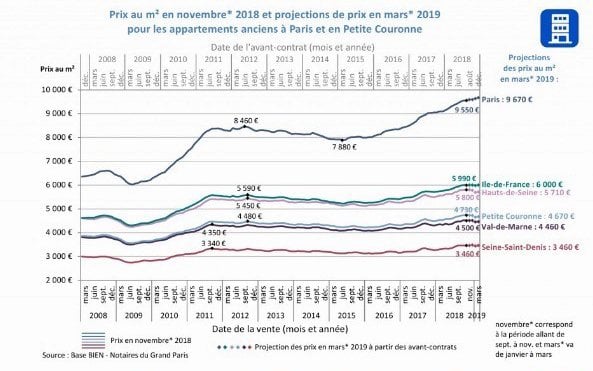
Courtesy Notaires de Paris
The top line below shows the price in Paris for appartements anciens or those in older buildings in Paris. While they’re at record highs, it’s important to note that they are only about 12% higher than the records achieved in 2012. See our earlier article about the slow advance of prices in Paris, The Seven Year Itch. Paris prices have never soared into the stratosphere, so today’s new highs are often lower than today’s prices in London and other major cities. For this reason, we feel Paris remains an investible location.
For 2019, Paris prices are expected to rise by 4.5% in Ile-de-France vs 2.9% in the Petite Couronne (the outer arrondissements of Paris) and 2.1 % in the Grande Couronne (the major suburbs).
* New apartments: Note that newer apartments that were built from the 1930s onwards are not as desirable and sell for less per square meter.
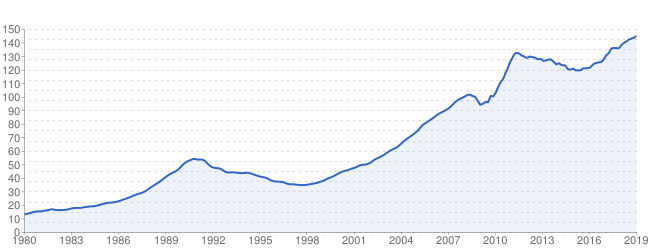
35-Year Evolution of Paris Prices: An Impressive Record… Basically Steady as She Goes
Prices in Paris didn’t follow the trends of other global capitals. They rose gradually from 1980 to peak in 1990. They plateaued until 1994, rising gradually for the next 12 years to 2007. Unlike the United States, there was no real estate crash in 2008 or 2009. There was a brief decline in 2009, but then a sharp increase in 2010. Prices plateaued for the next seven years (thus the title ‘The Seven Year Itch’), when we put out the ‘Buy’ recommendation on Paris real estate. Our timing was correct and prices have seen a steady increase ever since. We predict a continuation of that trend in 2019.
Average Price per Square Meter: For 2018, the average price per square meter of Paris apartments reached €9,550 as of November, representing an annual growth rate of +5.8%.
Column two shows the average price per square meter in Paris: € 9,550/ square meter.
Courtesy les notaires de Paris
For 2019, prices per square meter are predicted to reach € 9,670 in the first quarter, up 0.9% in three months, meaning a total rise of 6.3% over the previous 12 months.
Transactions Continue to Rise: The number of transactions in the whole Ile-de-France region is 30% higher than the ten-year average. Interestingly, it is 19% higher than the record-breaking prices achieved between 1999 and 2007.
2018 Number of Transactions in Paris and France
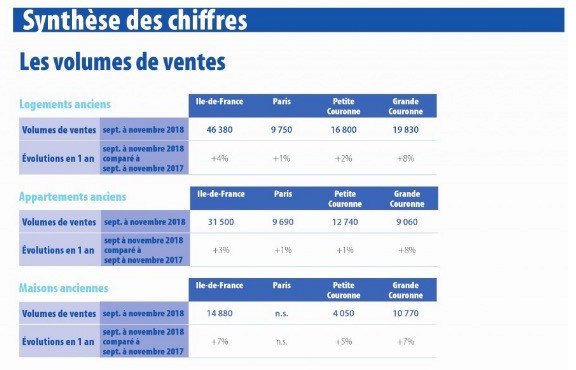
Sales volume and price for Paris and greater Paris © Notaires
Transactions in Paris grew by 1% in 2018, marking a total of 9,690 transactions. This was a lower increase, but not surprising given the smaller geography and higher prices.
Where Prices are Headed in Paris
We estimate +1.5% increase for the first half of 2019. Most believe there will be a flattening of prices and demand by fall, but we’re more optimistic thanks to the infamous UK Brexit. The reason is that with the UK exiting the common market, many export-led companies–especially all financial institutions based in the UK–are seriously considering a move to mainland Europe. Paris, Frankfurt, Amsterdam and Brussels have been wooing banks and other financial institutions in London to move their headquarters to their cities in Europe. It’s rumored that Citibank will move its operations to Paris.
Prices by Arrondissement
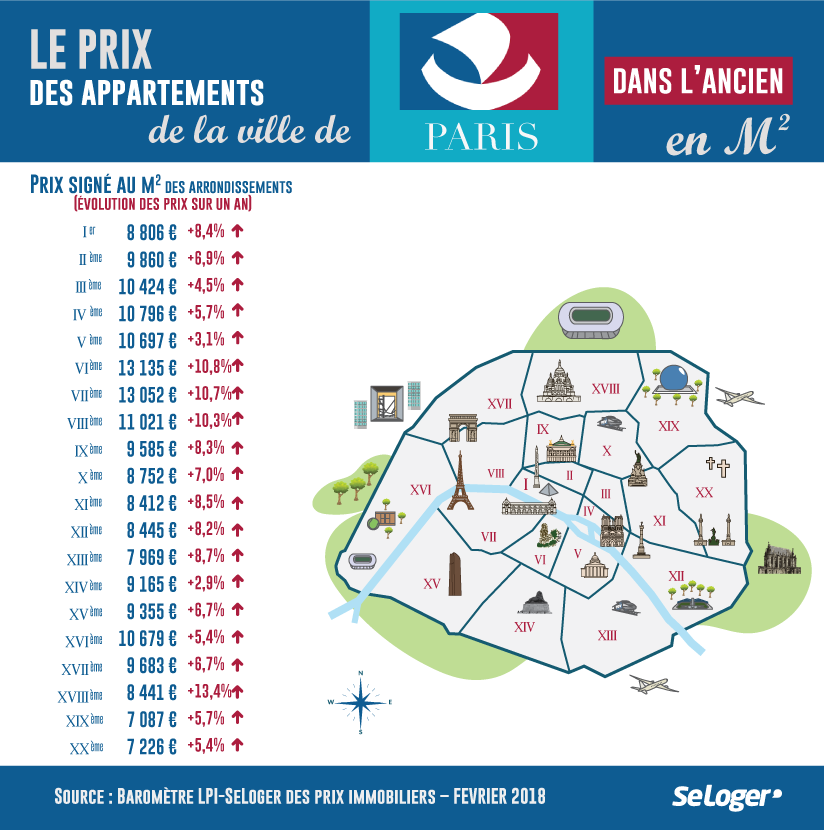
Courtesy of seloger.com
For serious buyers, this is one of the most fascinating charts, as it depicts the price increases by arrondissements. All twenty quartiers of Paris showed nice increases in prices, ranging from 3% in the 5th arrondissement to 10.7% in the 7th.
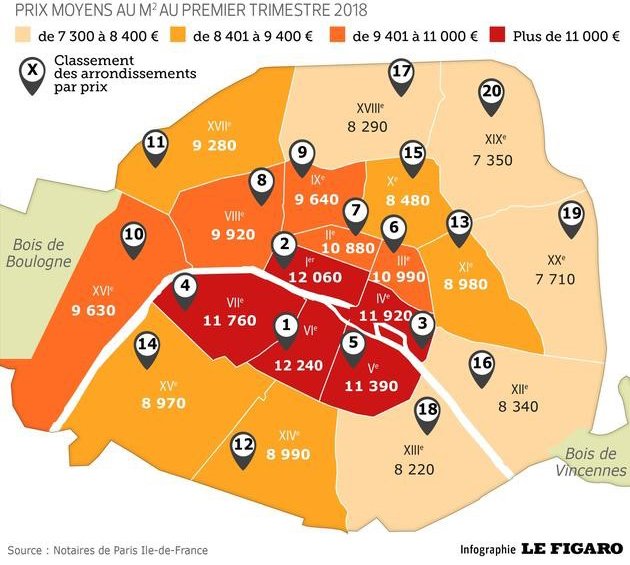
Which Quartiers Win the Crowns
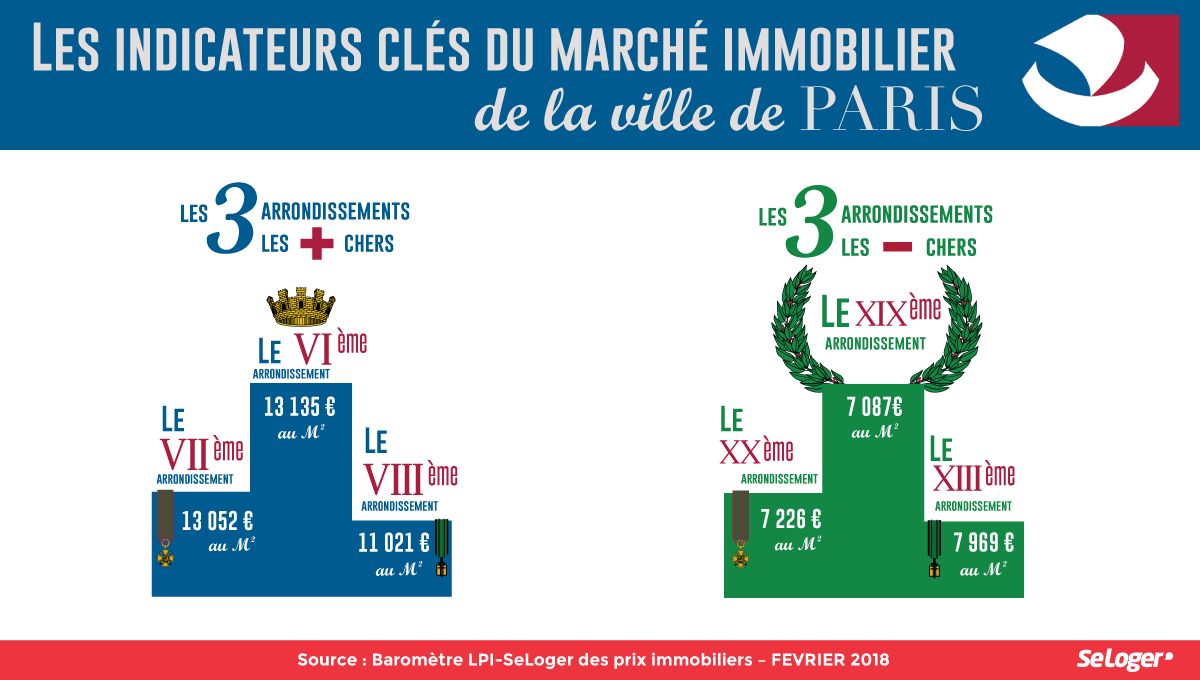
Courtesy of seloger.com
The most expensive quartiers have reigned in the top spots in terms of price and demand for decades, as the adage location, location, location proves itself. The 6th and 7th arrondissements win first and second place at €13,135 and €13,035/m2 respectively. The 8th arrondissement was third, at € 11,021/m2, but watch out as the 8th appears to be declining.
The least expensive quartiers remain the outer shell of the French arrondissement escargot that is Paris. The 19th arrondissment was the lowest at € 7,087/m2, along with the 20th and 13th.
Figaro price/arrondissement
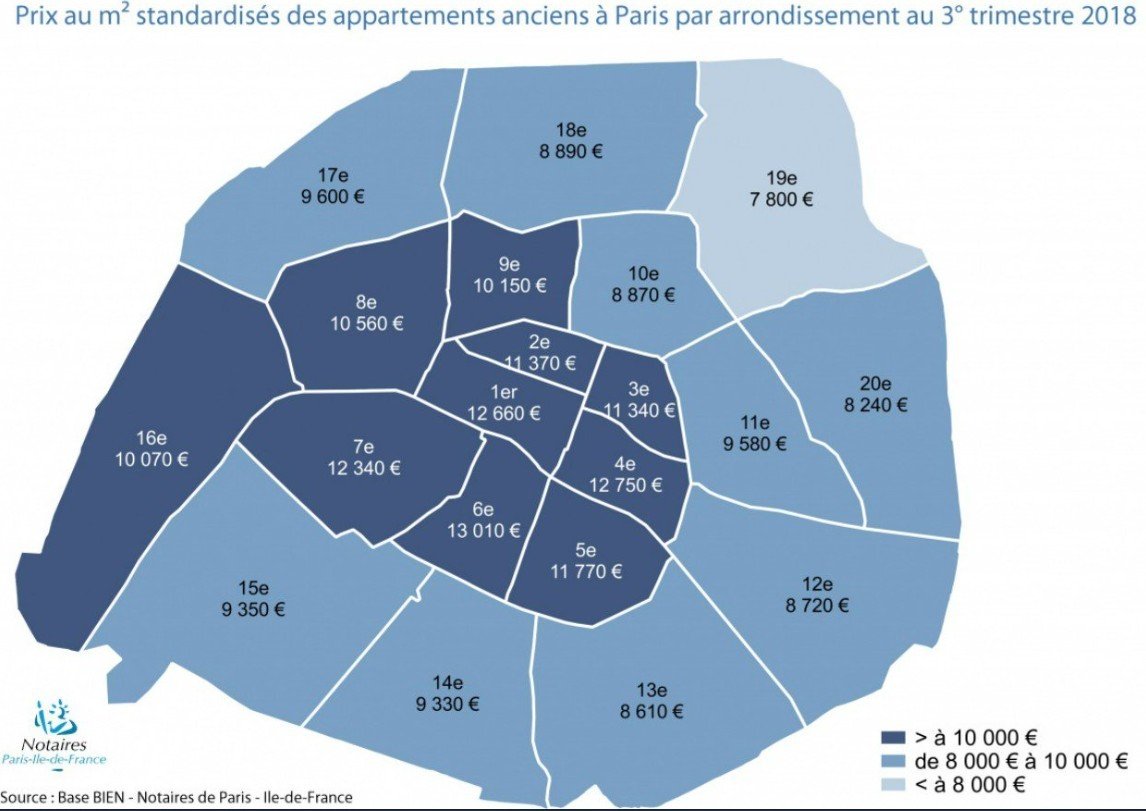
Above is a clear visual of prices by arrondissement for the third quarter of 2018, with € 10,000/m2 and over in dark blue.
A New Record: Seven Arrondissements Saw Average Prices Greater than €10,000 per Square Meter
This heat map of prices shows the hottest — or most desirable quartiers — in red, followed by the next most desirable in orange, then gold and yellow.
To us, this signals a gradually rising market overall, which is encouraging for potential buyers. Contrast this with the situation five years ago; there was a wide dispersion of prices between the most and least desirable quartiers.
That dispersion has been significantly reduced. Seven quartiers achieve average prices over € 10,000 per square meter vs only four in 2014–the 4th, 6th, 7th and 8th.
*In 2016, the 8th arrondissement was replaced by the 1st arrondissement in terms of prices. And last year three more quartiers joined the €10,000 per square meter club: the 2nd, 3rd and 5th arrondissements.
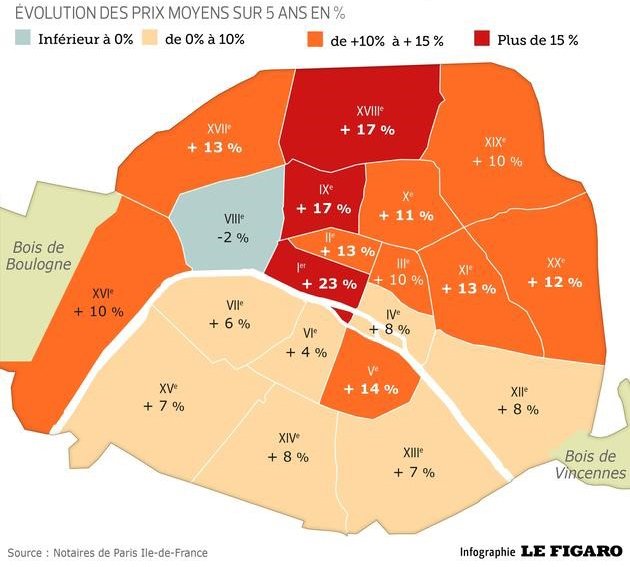
Watch Out: One Quartier Saw a Fall in Average Price
We would be concerned about investing in the 8th arrondissement (the Champs-Elysees, Arc de Triomphe), as it’s the only quartier where the average price actually fell by 2% over five years. While prices in the other 19 quartiers have risen.
Price Differences Have Narrowed
It’s interesting to note that the variances between quartiers has narrowed. If you compare the price variance between the 6th arrondissement – the most expensive arrondissement five years ago and still today – the price difference has reduced. (Again the only exception is the 8th arrondissement.)
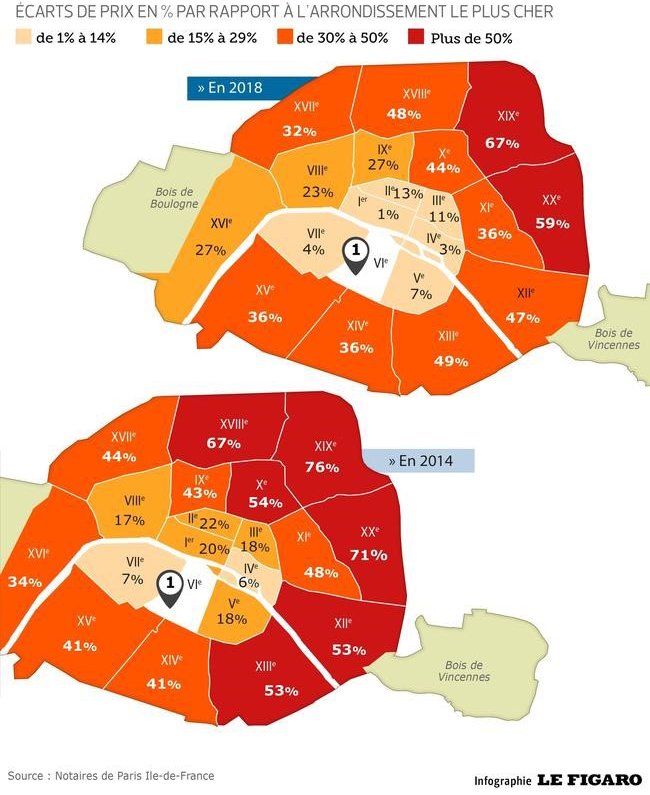
Top Map from 2018: Count the number of arrondissements highlighted in red, which show the quartiers that cost more than 50% less than the most expensive quartier–the 6th arrondissement. There are only two super-low quartiers.
Bottom Map from 2014: This compares with six quartiers whose prices were 50% or more lower than the 6th in 2014.
Who is Buying?
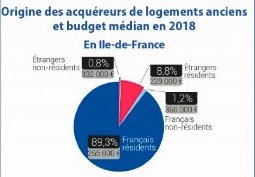
Breakdown of Purchasers in France Overall: For France overall, 9% of Paris homes were purchased by foreigners.
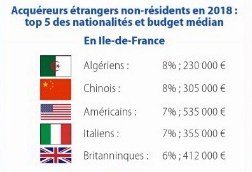
Nationalities of Purchasers 2019 – France Overall
Algerians were strong buyers in the South of France, understandable as Algeria is a former French colony.
The Chinese followed closely behind, at 8% of the foreign purchasers.
Americans, Italians and the English represented almost the same percentage of between 6% and 7% each.
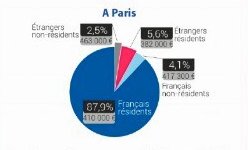
Foreigners Buying in Paris – 2019
- Total overseas nationals purchasing is approximately 10%
- 6% of buyers in Paris were foreign nationals who declare Paris as their fulltime residence.
- 5% were foreign nationals who purchased apartments in Paris as a second home.
- 2% of Paris buyers were French nationals who live outside of France.
Nationality of buyers in Ile- de- France and their average budget © Notaires
What Nationality Are These Paris Buyers?

Americans continue to lead as foreign buyers in Paris at 12%, closely followed by Italians at 11% of the foreign buyers.
British, Germans and Chinese buyers are virtually tied at 6 to 7% each.
Conclusion
In conclusion, we expect prices to continue a gradual increase in Paris for 2019. We believe the most central arrondissements, especially the ‘single digits’ remain the steadiest, although rising quartiers such as the 10th will see slightly higher increases.
Paris’ new short-term rental restrictions will discourage some overseas buyers from purchasing a second home in Paris. However, we believe there will be a marked increase in future permanent residents who are currently located in the UK as company headquarters move out of London and the UK to Paris and other major cities.